Visualizing a session
Browse every run — and watch an active one in near-realtime — as a chat-style web app. Easier to skim than jq-ing the raw log.
This page is the practical how-to; for the bigger picture — why a fully replayable run matters and what the wider observability surface gives you — see Hyper-observability.
How to visualize
tilth visualize                # serve the viewer; deep-links the latest session
tilth visualize <session_id>   # deep-link a specific session instead
tilth visualize --port 9000    # if the default port (8765) is taken
Starts a local web app (Python's built-in HTTP server — no extra dependencies) over the ~/.tilth/sessions/ directory and prints the URLs:
/— every session, newest first, with its status, task counts, and token (and, on OpenRouter, dollar) spend.-
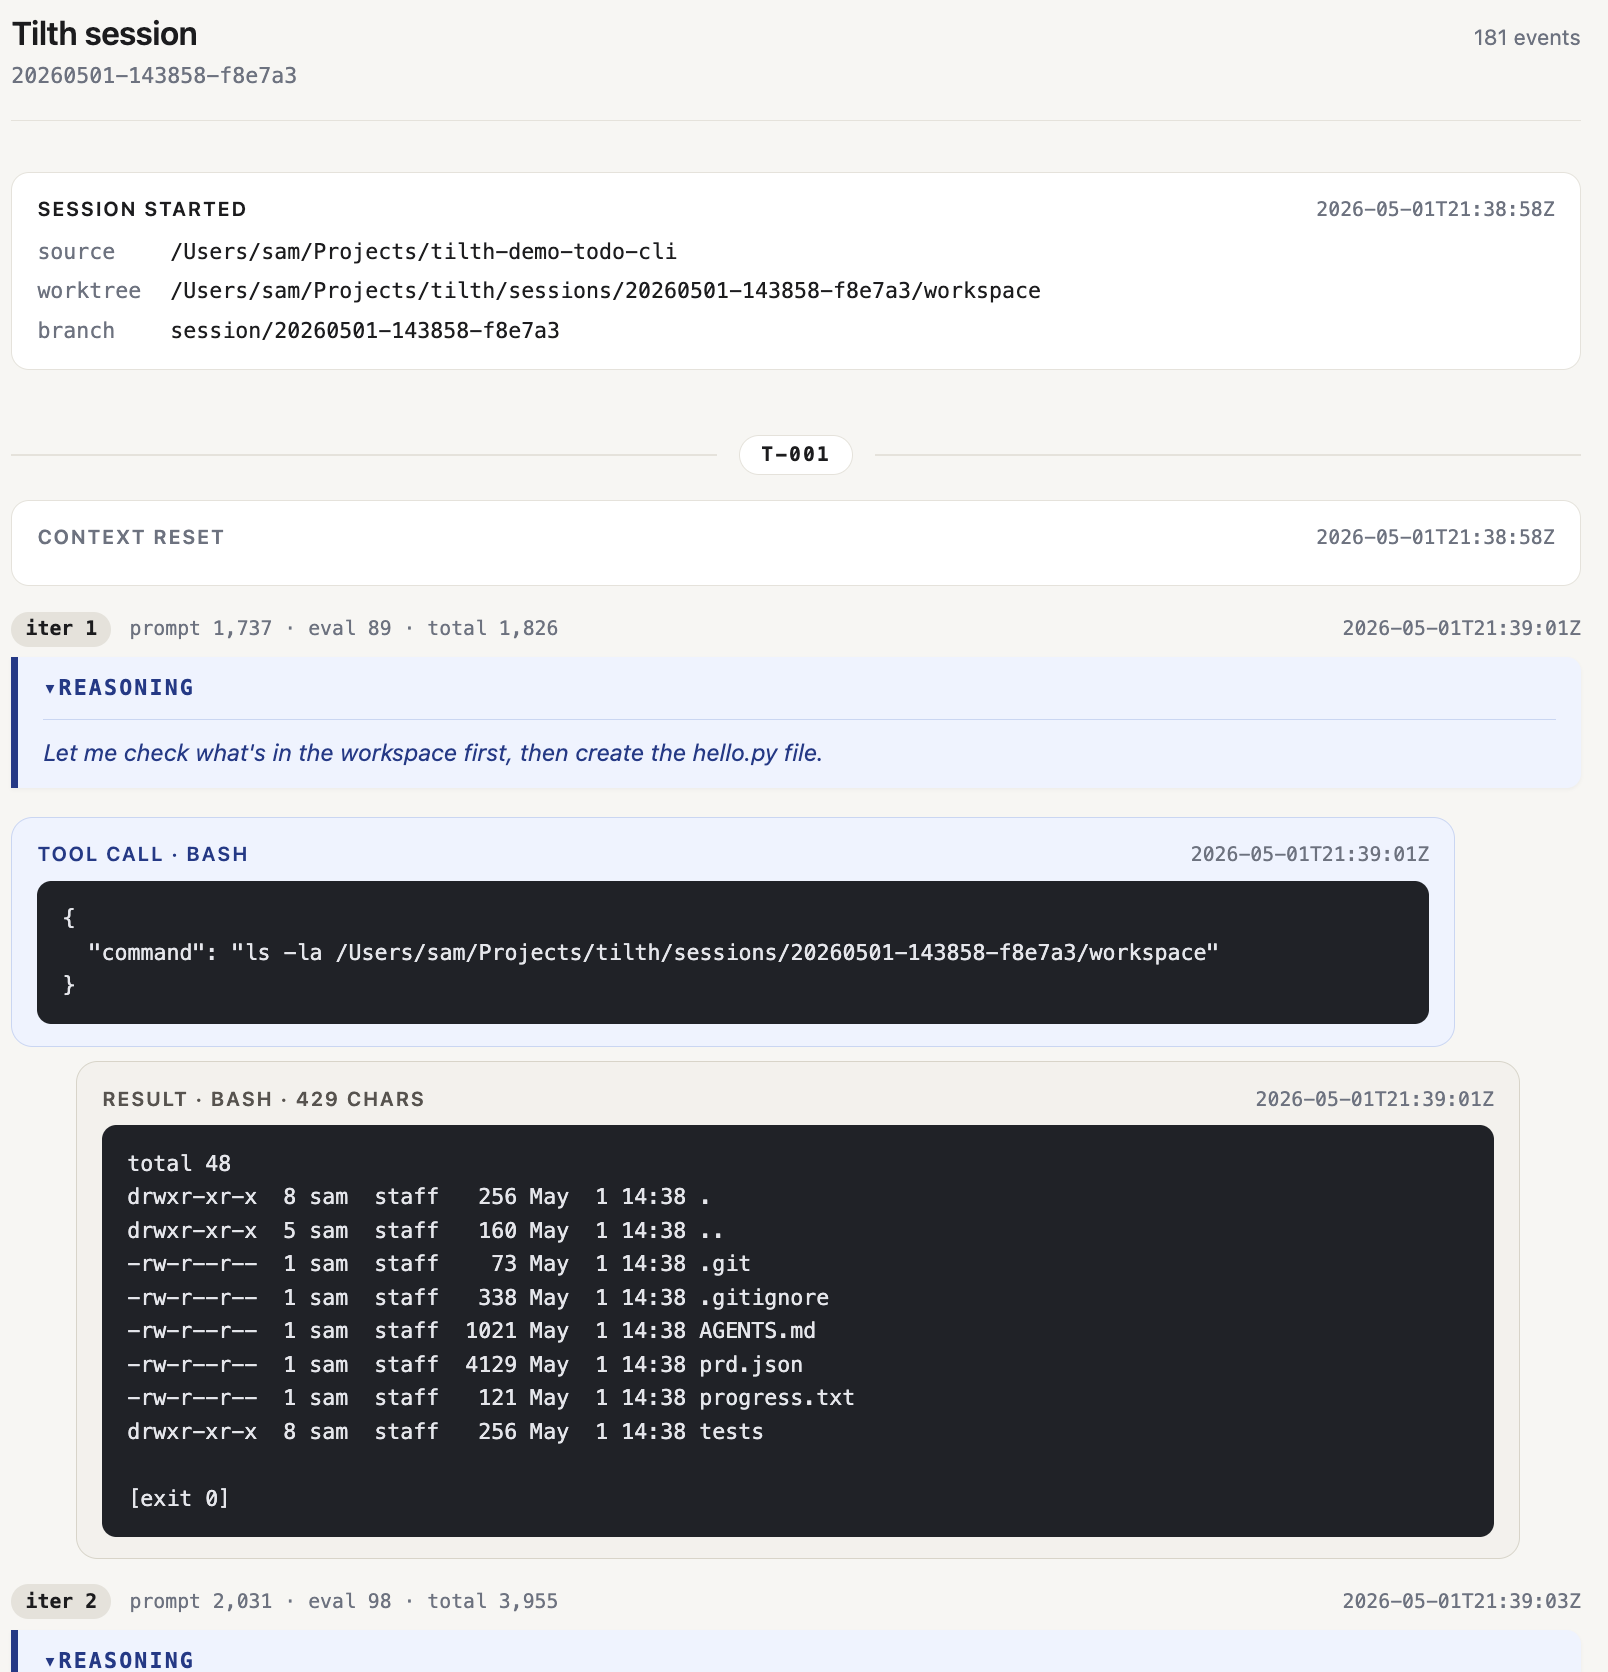
/session/<id>— one run rendered as a conversation:- model calls (with collapsible reasoning blocks where the model emitted any, and a health badge on provider-unhealthy attempts),
- tool calls and results (including the worker's
submit_case), - blocked tool calls (the
pre_toolveto) and harness nudges, - evaluator verdicts (accept / reject, with the rejection category, concern, evidence, and next-step on rejects),
- commits,
- and stops,
…all grouped by task, with live status / token / event-count chips in the header.
Above the conversation, a dashboard band summarizes the run at a glance. It opens with a Staff panel naming the worker and evaluator models the run actually used (read from the session_start event), then limit utilization — meters showing how close the run is to each configured cap: the per-session cost budget (TILTH_MAX_TOKEN_DOLLAR_SPEND, shown only when the provider reports cost) and wall clock (TILTH_MAX_WALL_CLOCK_MINUTES), plus per-task iterations (TILTH_MAX_ITERATIONS_PER_TASK) and, when set, evaluator calls (MAX_EVALUATOR_CALLS_PER_TASK). Each meter turns amber as it nears its cap and red at the edge, so a task grinding toward its iteration limit is visible before it fails. Below that sit the stat band — which breaks tokens down into prompt/eval (annotating cached and reasoning subsets when present) and, on OpenRouter, a cost tile split worker vs evaluator — then the session timeline and the context-pressure chart. The caps are read from the run's session_start event, so a replayed dashboard shows the caps that run actually enforced.
The viewer is read-only and loopback-only (it binds 127.0.0.1; the log contains your full prompts and diffs, so it isn't meant for the LAN). It only ever reads events.jsonl and checkpoint.json, so it's safe to leave running next to an active tilth run.
Watching a live run
The session page tails events.jsonl as the harness appends to it — new model calls, tool results, and verdicts stream in about a second after they happen, and the header (which stays pinned as you scroll) tracks status and token spend from the checkpoint. A floating nav in the corner offers ↑ top / ↓ bottom jumps plus a follow toggle: switch it on to keep the view pinned to the newest event; scrolling up to read history switches it back off, and nothing but the toggle switches it on. When the run reaches a terminal state the page keeps polling slowly, so a later tilth resume picks up on screen without a reload.
Rendering happens server-side from the same renderer for every view — what you see live is byte-identical to what you'd see replaying the finished log.
What it looks like
When to use it
- During a run, to watch the worker think, act, and get judged — without a TUI to babysit; close the tab and nothing is lost.
- After a clean run, for a quick scan of how the agent solved each task.
- After a failed run, to see exactly where the loop diverged before a cap or an error.